Data-table exploration uses records to examine trends, differences, and relationships. Within XCORE, the aim is to turn a business question into an interpretable analysis, with source context and uncertainty visible throughout the investigation.
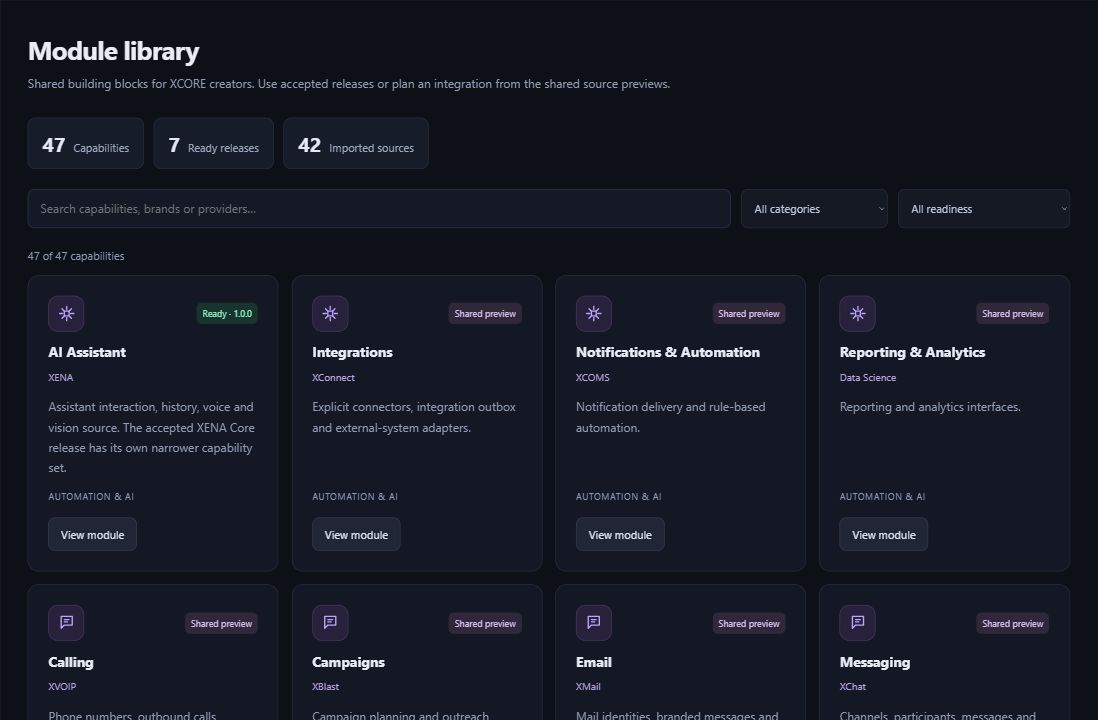
Inside the creation layer · actual XCORE module-library capture, November 2, 2026. Release labels and account permissions apply.
THE PURPOSE IN PRACTICE
Investigate patterns, trends, and correlations in tables, then relate findings to business questions.
An illustrative analysis of delayed jobs might compare dates, work types, locations, and staffing conditions. First check missing records, inconsistent categories, and whether the comparison groups cover similar periods. A visible association can suggest a question to investigate without establishing its cause.
02
Connect the finding to a bounded decision
Explain the method, selected records, limitations, and possible alternative explanations. Agree whether the next step is further data collection, an operational review, or a small test. Customized analysis and growth modeling need a defined scope; this profile does not promise that a dataset will reveal a commercially valuable prediction.
PLAN YOUR IMPLEMENTATION
Match the scope to your needs.
Choose the business tools your organization needs. Our team can confirm the app, access, connections and setup for your company before implementation.
Does correlation prove that one factor caused another?+
No. A relationship in the records can have several explanations, including missing context or a shared underlying factor. Treat it as evidence to investigate rather than a complete causal conclusion.
What should be checked before comparing groups?+
Definitions, dates, sample sizes, units, missing values, and whether the groups represent comparable work. A different collection method or category meaning can create an apparent difference that is not an operational change.
How much data is enough?+
That depends on the question, variation, method, and intended decision. The useful first step is to define what the analysis must distinguish and examine the available evidence, rather than choose an arbitrary row target.
What should an analysis handover contain?+
The question, sources, selected period, method, findings, limitations, and an understandable next step. A chart without those details can be difficult for another person to review or use responsibly.
THE PEOPLE’S CORPORATION
A future for people.
Personal control. Human opportunity. Stronger local economies and a voice for communities.